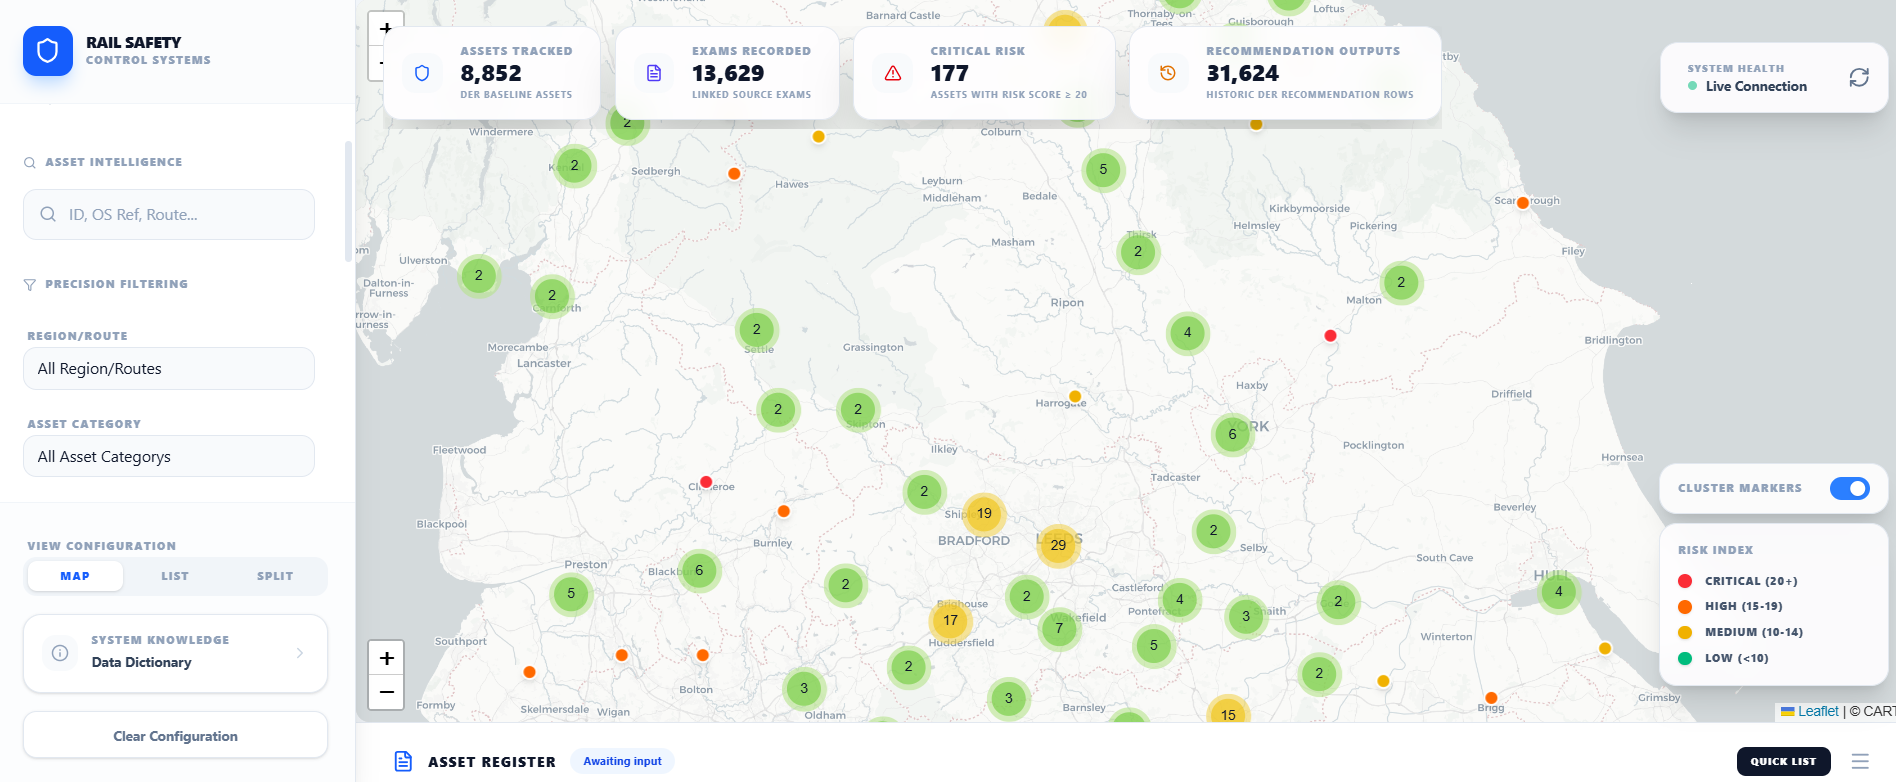
Bridge, culvert and railway structures asset intelligence
Based on experience designing and analysing a 2012/13 Amey-delivered Detailed Examination Review process for Network Rail structures. This is not a current Network Rail operational system.
A modernised DER-style asset intelligence and review dashboard for bridges, culverts and railway structures. The platform provides map-first views of the asset estate, structured review workflows and risk-based prioritisation tools.
Problem
Rail structures data, examination records, recommendations, risk scores and location references are often fragmented across legacy systems, spreadsheets, Access databases and asset registers. Visibility of backlog, risk distribution and recommendation status is limited and difficult to aggregate.
Approach
Asset = physical bridge, culvert, wall, tunnel or structure
Exam = source examination evidence and photographs
Review = engineering judgement and recorded decisions
Risk score and severity = review outputs with traceable rationale
Recommendation = review output with lifecycle tracking
Evidence = documents, photos, reports linked to asset and exam
Technologies / methods
PostgreSQL / PostGISNext.jsMapLibre GLNeon / AWSReactREST API
Outputs
UK map of assets filtered by route, asset type, severity and risk
Asset profile drawer with exam, review and recommendation history
Backlog and overdue-action visibility
Risk-based prioritisation across the asset estate
Recommendation lifecycle management (open, in progress, closed)
DER baseline narrative and historical comparison
Evidence pack generation for audit and regulatory review
Engineering review and assurance workflow for marine assets
A structured engineering review and assurance workflow for ship or marine assets, documents, photographs and recommendations. Supports survey evidence management, defect recording, recommendation lifecycle and status reporting.
Problem
Marine inspections and evidence can be spread across survey reports, photographs, spreadsheets and operational notes. There is often no single view of outstanding defects, incomplete surveys, open actions or review status across the asset fleet.
Approach
Asset-centred model with survey, inspection and review records linked
Evidence workbench for document and photo review
Structured recommendation and action creation
Status tracking from open through to closed and verified
Management dashboards showing fleet review status at a glance
Map-first dashboards for vessel, port, route and operational monitoring
Map-first intelligence dashboards for vessel, port, route, incident, risk or operational monitoring. Designed for shipping and fleet operations that need fast visibility of location, activity, risk, delays, incidents and operational context.
Problem
Shipping and fleet operations need fast visibility of location, activity, risk, delays, incidents and operational context. Data is often siloed across AIS feeds, voyage management systems, port records and operational spreadsheets.
Approach
Combine geospatial data, event streams, tabular records and analytical dashboards
AIS and positional data connected to asset and voyage records
Incident and risk event modelling with location and timeline
Route and movement analysis with historical comparison
KPI design aligned to operational and commercial priorities
Technologies / methods
PostgreSQL / PostGISMapLibre GLNext.jsAIS data integrationTableau / Power BI
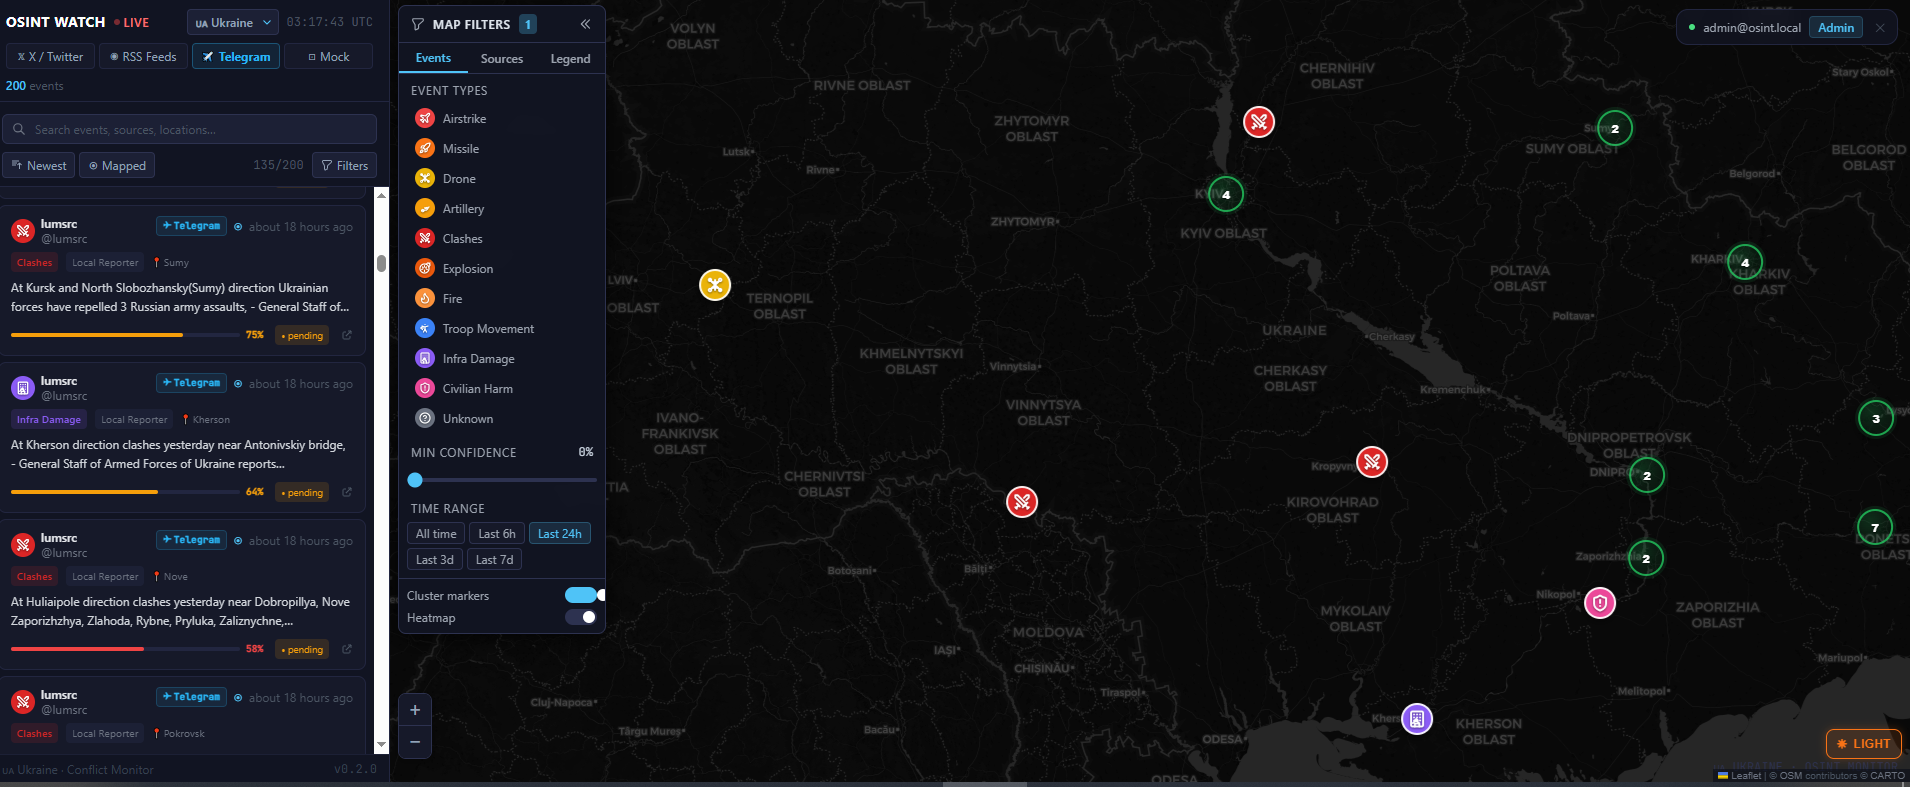
Map-based open-source intelligence for events, entities and infrastructure
A map-based open-source intelligence platform for monitoring events, locations, entities, infrastructure and risk. Structures raw OSINT data into location-aware, confidence-scored analytical dashboards.
Problem
OSINT data can be noisy, fragmented and hard to interpret without spatial context. Sources have varying reliability. Events may be geolocated imprecisely. Connecting events, entities and locations into analytical intelligence requires structured data modelling.
Approach
Structure data into locations, events, sources, confidence, timelines and map layers
Source confidence scoring and provenance tracking
Entity and location profile model with relational links
Timeline analysis with event clustering and pattern identification
Network graph analysis of entity-event-location relationships
Portable platform pattern for asset risk, evidence and decision support
A reusable platform pattern for connecting asset records, risk scoring, incidents, evidence and recommendations into a decision-support system. Designed to work with legacy data, incomplete records and organisations at varying levels of data maturity.
Problem
Many organisations have legacy data, incomplete records and no clear link between asset condition, evidence, decisions and actions. Risk decisions are inconsistent and difficult to defend. Evidence is scattered and audit trails are incomplete.
Approach
Create a portable geospatial data model from existing data sources
Standardise risk scoring against a defined risk matrix
Link assets to evidence, decisions, recommendations and actions
Create a clear audit trail from assessment through to mitigation
Build dashboards for operational, management and regulatory use
Technologies / methods
PostgreSQL / PostGISNext.jsTableau / Power BIMapLibre GLPython / pandasREST API
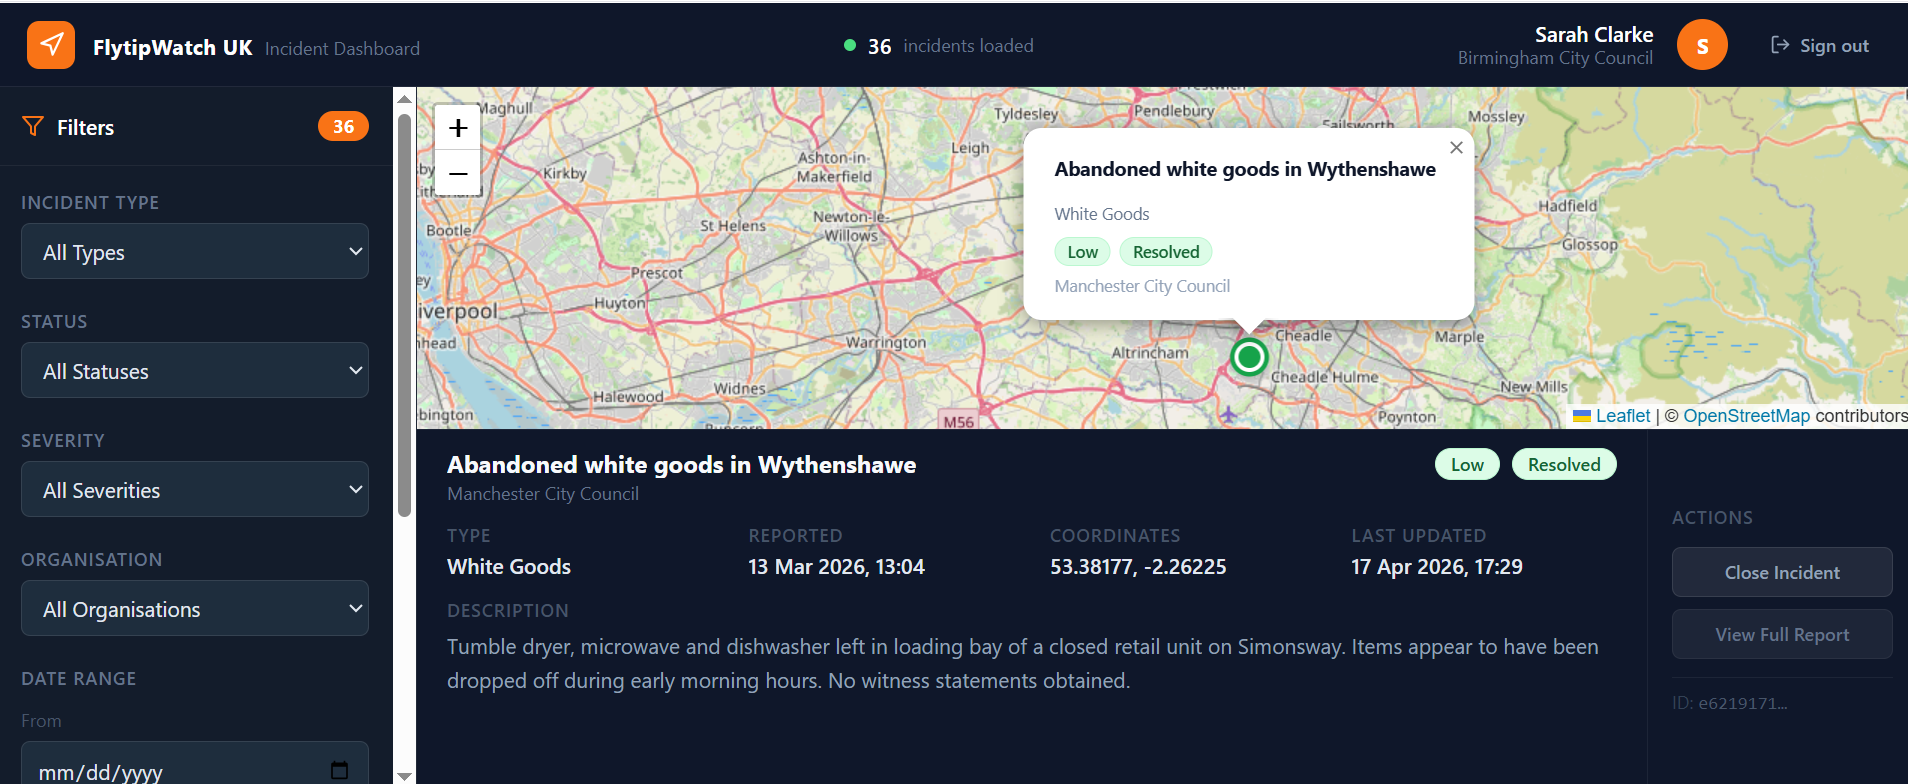
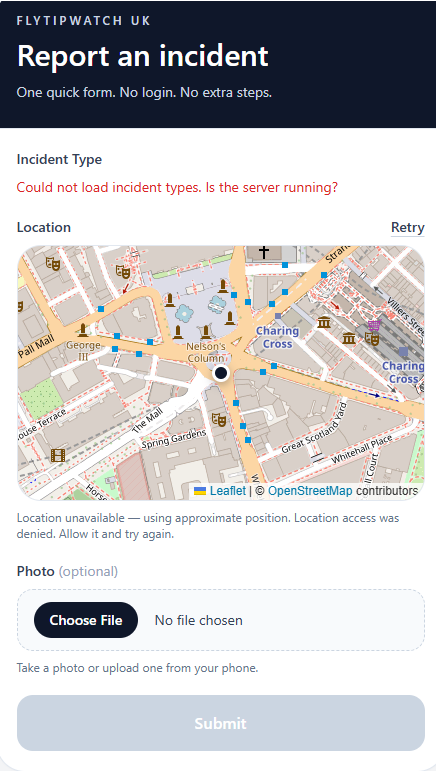
Multi-tenant Civic Incident & Land Intelligence Platform
Geospatial case management for civic, land, environmental and infrastructure incident reporting
Tippov is a multi-tenant, multi-organisation civic incident reporting and case management platform for location-based issues across civic, land, infrastructure, environmental and safety contexts. The platform supports mobile-first field reporting, configurable incident taxonomies, photographic evidence, geospatial incident capture, organisation-level permissions, case management workflows, KPI dashboards and a shared operating picture across participating organisations. Each incident enters a case management workflow where it can be reviewed, assigned, tracked, updated and resolved.
Problem
Councils, landowners, estate managers, infrastructure operators and multi-agency teams need a unified operational view of incidents across their areas of responsibility. Reports arrive through multiple channels with no single spatial picture, no consistent case management and no clear way to share intelligence across organisational boundaries. Tippov addresses this by connecting public and field reporting to an operational platform with structured case management, evidence tracking, shared visibility and performance reporting. The same platform pattern is relevant to local authorities, landowners, estate managers, environmental teams, infrastructure operators, ports, utilities, safety teams and multi-agency response partnerships.
Platform capabilities
Multi-tenant architecture — separate organisations, groups or clients within one platform
Multi-organisation and cross-agency use — shared incident visibility and coordinated response
Organisation-level permissions — controls who can view, manage, assign or resolve incidents
Mobile-first public and field reporting — reports from the public, staff or field teams, no account required
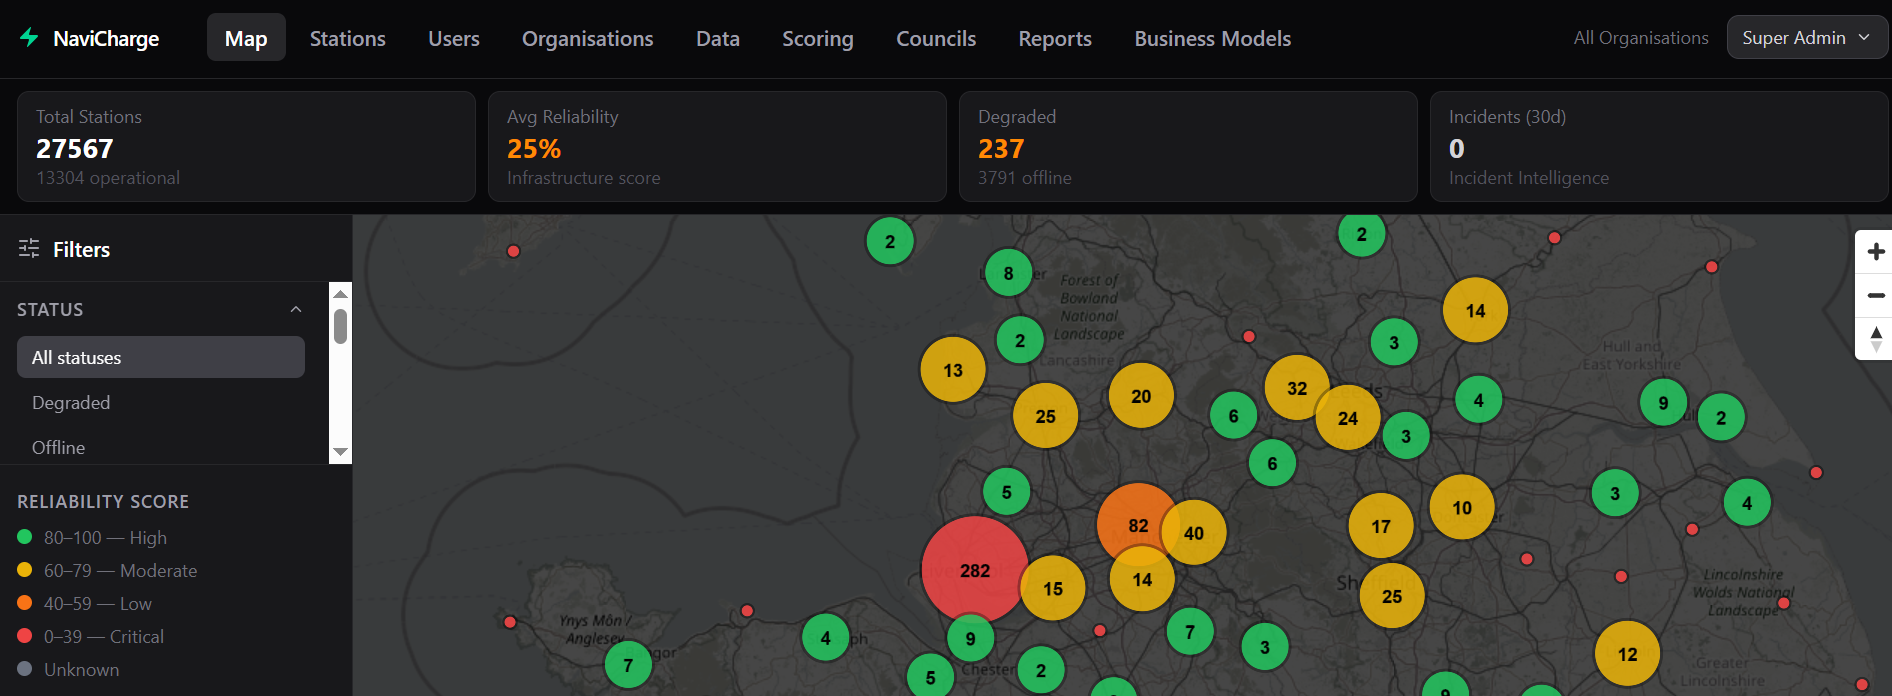
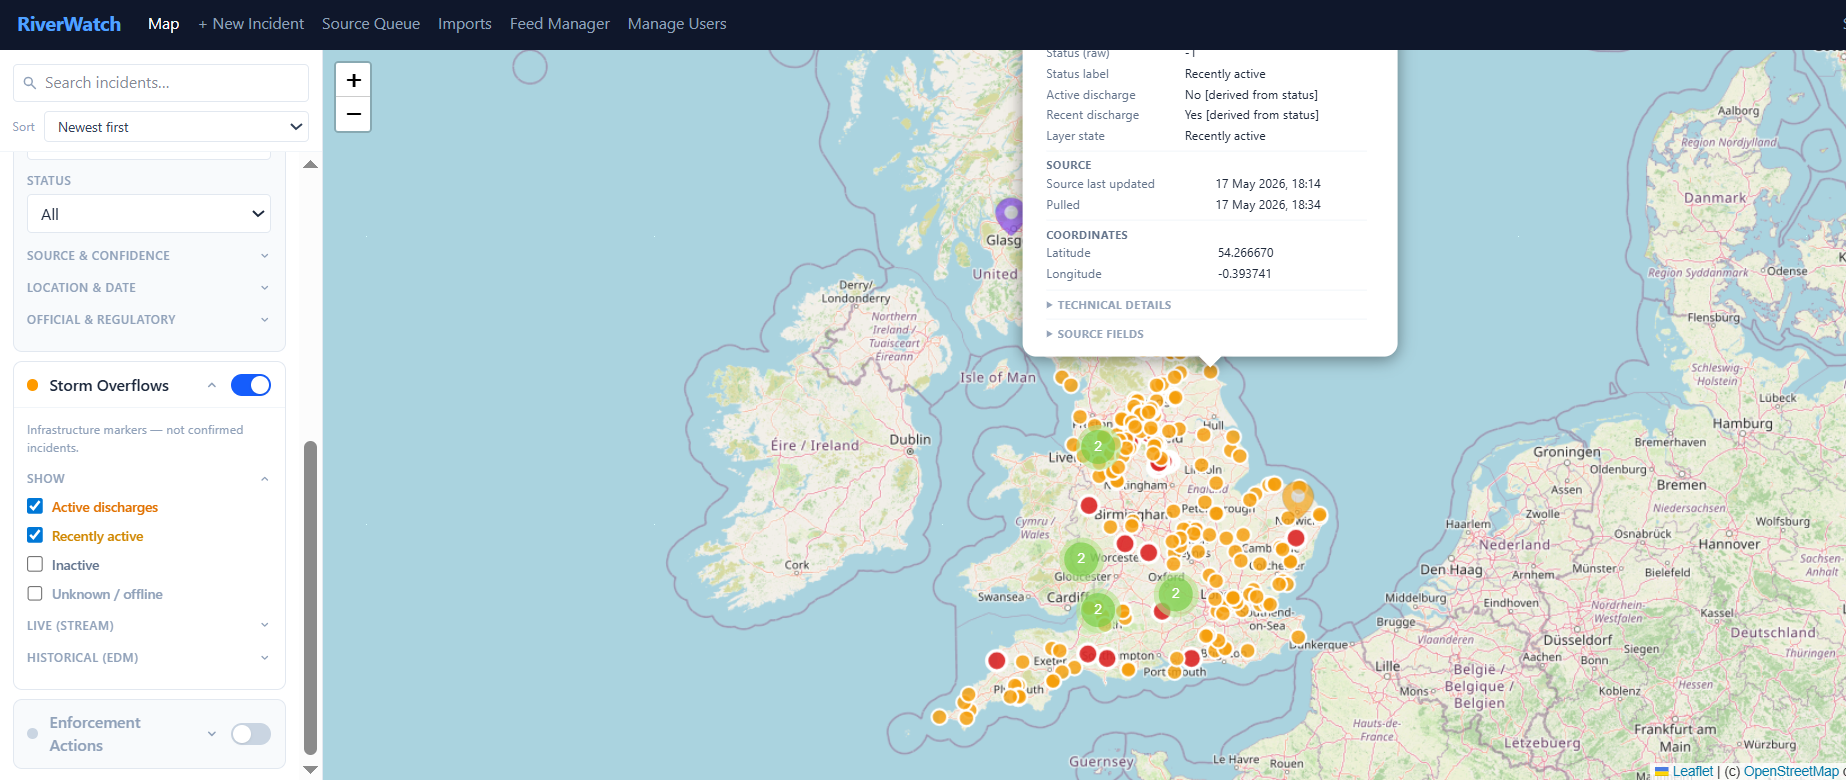
Geospatial intelligence for watercourse health, ecological surveys and environmental compliance
A geospatial platform for ecological and river monitoring, combining watercourse location intelligence, survey data, sensor readings and environmental compliance records into a single operational view. Designed for environmental teams, catchment partnerships, landowners and regulatory bodies that need to understand and report on watercourse health, ecological condition and compliance status across a geographic area.
Problem
Ecological and river monitoring data is typically scattered across field survey spreadsheets, sensor exports, regulatory submissions and internal reports. There is rarely a single spatial view connecting monitoring stations, survey records, compliance history and environmental condition. Understanding trends, identifying deterioration and meeting reporting obligations requires significant manual effort.
Approach
Location-anchored monitoring stations, survey sites and watercourse reaches
Survey and observation records linked to place, date and surveyor
Sensor and telemetry data integrated with field survey evidence
Ecological condition scoring and compliance status per location
Historical trend analysis across stations and catchment areas
Map-based operational overview for field teams and managers
Watercourse and monitoring station map with condition overlays
Survey and observation record management
Sensor data integration and trend visualisation
Ecological condition and compliance scoring per site
Catchment-level summary dashboards
Regulatory and statutory reporting exports
Field team task management and survey scheduling
Rail and infrastructure owners
What this means for rail and infrastructure assurance
For rail and infrastructure organisations, a GeoTelligence-style platform offers a credible route toward live geospatial asset intelligence without displacing existing operational systems.
Backlog visibility by route, type and severity
Risk-based prioritisation of examination and renewal
Examination and assessment compliance tracking
Recommendation lifecycle management
Evidence pack generation for audit and regulator
Baseline-to-current historical comparison
Climate and scour risk overlay capability
Future-ready for incident and bridge strike recording
Get in touch
Interested in a private demo?
Use case demonstrations are available in confidence. Discuss how the platform concepts could apply to your data, systems and operational context.